Data Visualization Services
Premium Data Visualization Services
Transforming Your Data Siloes into Interactive Reports to Increase Visibility

Achieve Data Enlightenment with Our Data Visualization Services
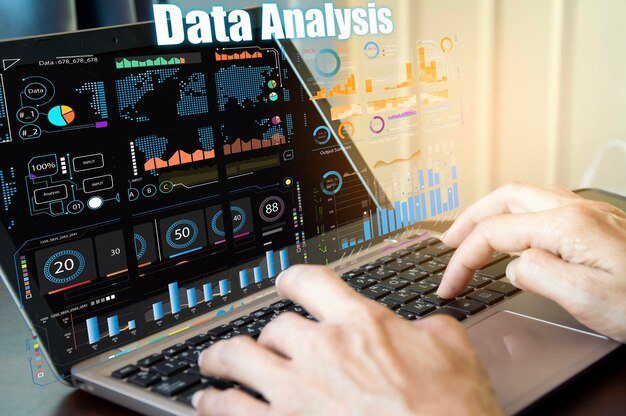
Leverage the power of advanced data visualization services with DeepX Solution as we transform complex datasets into visually compelling insights. As a leading data visualization company, we utilize cutting-edge computer vision and natural language processing (NLP) techniques to extract actionable insights, ensuring comprehensive and meaningful visualizations.
Our data visualization services process and interpret visual data to identify patterns, trends, and anomalies. By integrating NLP, we extract relevant information and sentiment from textual data, enriching visualizations with contextual understanding.
Through the fusion of advanced technologies, we create data visualizations that not only captivate but also empower you to uncover complex relationships and make data-driven decisions with confidence.
Our skilled professionals blend technical expertise with creative design to develop visually striking and interactive dashboards. With DeepX Solution’s data visualization services, unlock the full potential of your data, gain deeper insights, and communicate complex information effectively within your organization.
Embrace the transformative power of data visualization and elevate your data analysis capabilities to new heights.


Providing the Right Visuals to Track Trends & Compare KPIs
Our data visualization services include technology consulting, implementation, and ongoing support to create visually appealing and intelligent reports.
We offer custom data visualization solutions tailored to your specific KPIs and business needs. Our team helps transform your data into business intelligence (BI) dashboards, connecting any business data source to minimize reliance on manual data feeds. By clearly defining data sources, data flows, and the functions of each component, we prioritize your reporting needs to ensure accuracy and efficiency.
With extensive experience in Power BI and Tableau, we can assist in migrating your existing reporting systems from Excel or Tableau to Power BI. Our in-depth knowledge of cloud platforms such as AWS (Amazon Web Services) and Microsoft Azure allows us to leverage cloud analytics for powerful data visualization solutions.
Why Choose Us?
20 Years of Expertise
Experience is key, especially when serving diverse industries. With over 20 years of experience, our team has been helping enterprises achieve success through innovative data solutions.
Agile Team
Our team of expert data scientists and analysts has extensive experience in designing and developing customized data visualization solutions tailored to meet your business needs.
Ongoing Support
From the data preparation phase to managing and optimizing your data visualization process, we provide continuous support, ensuring your platform, dashboards, and datasets perform at their best.
Bespoke Solutions
We understand that each business faces unique challenges. That’s why we offer customized solutions specifically designed to address your organization’s requirements and goals.
Your Data Security is Our Priority
We take data security and confidentiality seriously. By following industry-standard practices and security protocols, we ensure your data remains secure throughout the entire data visualization process.

Successful projects and satisfied customers
Our clients value working with us and the results we achieve together. We have helped numerous companies optimize their digital strategy and thus achieve their marketing goals, for example:


Discover, Craft & Tell Compelling Stories with Data Visualization.
Reach out to us today and let us help you navigate your data landscape with captivating and insightful visualizations.
No bullshit and no hassle
Our promise: Your data is safe with us. If at any time you no longer wish to be contacted by us, we will do
so. Period.
Frequently Asked Questions (FAQs)
Data visualization is the process of transforming complex data into visually engaging and easy-to-understand formats, enabling quick insight extraction. It involves several steps, including data preparation, cleansing, and management. Data scientists then represent the information through interactive dashboards, graphics, charts, and other visualization techniques, making it accessible and actionable for decision-makers.
Extracting meaningful insights from large datasets across multiple sources can be challenging. Without proper visualization, enterprises often struggle to draw actionable conclusions. Data visualization simplifies this process by transforming complex data into engaging, easy-to-understand formats. It helps uncover hidden patterns and relationships, enabling businesses to make data-driven decisions more efficiently.
We offer a wide variety of visualization types, including bar charts, line charts, heatmaps, maps, pie charts, scatter plots, and more, depending on your specific requirements. Our team helps determine the most effective visualization approach to ensure you get the insights and output you need.
As an experienced data visualization company, we guide you throughout your data journey—from technology consulting to continuous support, ensuring we meet your business goals. Our expert data scientists collaborate closely with you to foster a data-driven culture, providing all stakeholders with access to essential information and valuable insights that empower better decision-making. We thoroughly analyze each data source, fact, figure, and IT solution to custom-design your dashboards and reports.
Our approach includes:
1. Data Collection – We gather accurate data from multiple sources to capture the true strength of your business.
2. Data Cleaning – We ensure data integrity by removing errors, inconsistencies, and outliers.
3. Data Modeling – Using data mapping techniques, we determine the most suitable chart or graph type based on the insights you wish to highlight.
4. Data Preparation – We structure the data by defining columns, grouping values, and aggregating data as needed for effective visualizations.
5. Data Visualization – We apply our visualization expertise to the prepared data, creating an intuitive IT solution tailored to your needs.
Ready to Turn Your Data into a Visual Masterpiece?
We’re here to help you unleash the full potential of your data by turning it into compelling visual stories. Contact us now to schedule a consultation with our experts and discover how our data visualization services can supercharge your decision-making.

